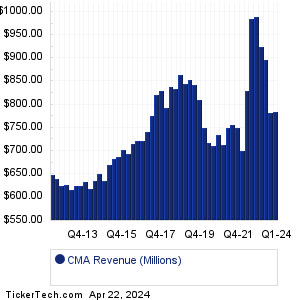
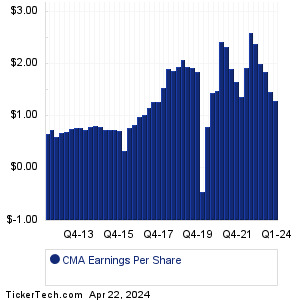
CMA Past Earnings image   This CMA past earnings page last updated 12/6/2024
CMA Past Earnings
PeriodPast Earnings DateAdj. EPS
Q3 202410/18/20241.370
Q2 20247/19/20241.530
Q1 20244/18/20241.290
Q4 20231/19/20241.460
Q3 202310/20/20231.840
Q2 20237/21/20232.010
Q1 20234/20/20232.390
Q3 202210/19/20222.600
Q2 20227/20/20221.920
Q1 20224/20/20221.370
Q4 20211/19/20221.660
Q3 202110/20/20211.900
Q2 20217/21/20212.320
Q1 20214/20/20212.430
Q4 20201/19/20211.490
Q3 202010/20/20201.440
Q2 20207/21/20200.800
Q1 20204/21/2020-0.460
Q4 20191/21/20201.850
Q3 201910/16/20191.920
Q2 20197/17/20191.940
Q1 20194/16/20192.080
Q4 20181/16/20191.95
Q3 201810/16/20181.86
Q2 20187/17/20181.9
Q1 20184/17/20181.54
Q4 20171/16/20181.28
Q3 201710/17/20171.27
Q2 20177/18/20171.15
Q1 20174/18/20171.02
Q4 20161/17/20170.99
Q3 201610/18/20160.84
Q2 20167/19/20160.77
Q1 20164/19/20160.34
Q4 20151/19/20160.71
Q3 201510/16/20150.74
Q2 20157/17/20150.73
Q1 20154/17/20150.73
Q4 20141/16/20150.8
Q3 201410/17/20140.82
Q2 20147/15/20140.8
Q1 20144/15/20140.73
Q4 20131/17/20140.77
Q3 201310/16/20130.78
Q2 20137/16/20130.76
Q1 20134/16/20130.7
Q4 20121/16/20130.68
Q3 201210/17/20120.61
Q2 20127/17/20120.73
Q1 20125/1/20120.660
CMA Past Revenue
PeriodPast Earnings DateGAAP
Q3 202410/18/20240.81B
Q2 20247/19/20240.82B
Q1 20244/18/20240.78B
Q4 20231/19/20240.78B
Q3 202310/20/20230.90B
Q2 20237/21/20230.92B
Q1 20234/20/20230.99B
Q3 202210/19/20220.98B
Q2 20227/20/20220.83B
Q1 20224/20/20220.70B
Q4 20211/19/20220.75B
Q3 202110/20/20210.76B
Q2 20217/21/20210.75B
Q1 20214/20/20210.71B
Q4 20201/19/2021734.00M
Q3 202010/20/20200.71B
Q2 20207/21/20200.72B
Q1 20204/21/20200.75B
Q4 20191/21/20200.81B
Q3 201910/16/20190.84B
Q2 20197/17/20190.85B
Q1 20194/16/20190.84B
Q4 20181/16/2019864.00M
Q3 201810/16/2018833.00M
Q2 20187/17/2018838.00M
Q1 20184/17/2018793.00M
Q4 20171/16/2018830.00M
Q3 201710/17/2017821.00M
Q2 20177/18/2017776.00M
Q1 20174/18/2017741.00M
Q4 20161/17/2017722.00M
Q3 201610/18/2016722.00M
Q2 20167/19/2016714.00M
Q1 20164/19/2016693.00M
Q4 20151/19/2016703.00M
Q3 201510/16/2015686.00M
Q2 20157/17/2015682.00M
Q1 20154/17/2015669.00M
Q4 20141/16/2015635.00M
Q3 201410/17/2014651.00M
Q2 20147/15/2014636.00M
Q1 20144/15/2014618.00M
Q4 20131/17/2014634.00M
Q3 201310/16/2013625.00M
Q2 20137/16/2013624.00M
Q1 20134/16/2013616.00M
Q4 20121/16/2013627.00M
Q3 201210/17/2012624.00M
Q2 20127/17/2012640.00M
Q1 20125/1/20120.65B
Quotes delayed 20 minutes

Email EnvelopeFree CMA Email Alerts:
Get Dividend Alerts
Get SEC Filing Alerts
10 Most Oversold S&P 500 Stocks
10 Most Overbought S&P 500 Stocks
10 ETFs With Stocks Insiders Are Buying
10 ETFs With Most Upside To Targets
The DividendRank Top 25
Warren Buffett Dividend Stocks
10 Cheap Dividend Stocks Under $10
10 Top DividendRank'ed Energy Stocks
The 10 Highest Yielding Preferred Stocks
The 15 Most Active S&P Call & Put Options
Comerica (CMA) is categorized under the Financials sector; to help you further research past earnings across stocks, below are some other companies in the same sector:

CMCT Past Earnings
CME Past Earnings
CMO Past Earnings
CMTG Past Earnings
CNA Past Earnings
CNFR Past Earnings
CNNB Past Earnings
CNNE Past Earnings
CNO Past Earnings
CNOB Past Earnings

CMA Past Earnings Q&A

What was the best and worst CMA past earnings results?
For Comerica, I'm wondering what the company's very best and worst earnings results have been, on an earnings per share basis?

✔️Accepted answer: The highest CMA past earnings result in our data set was 2.600/share posted in Q3 2022, while the lowest was in Q1 2020 when CMA posted -0.460/share.

  Suggested answer: The biggest top line earnings performance — aka revenue — quarter was in Q1 2023 when CMA reported 0.99B in revenue, while the quarter with the lowest revenue in our data set was Q1 2013 at 616.00M of revenue.

  Suggested answer: There are 50 CMA past earnings results in our data set.

On this page we presented the CMA past earnings date information for Comerica. Reviewing that CMA Past Earnings for the company, we see that the highest past earnings result in our data set was in Q3 2022, when CMA posted adjusted EPS of 2.600/share. Meanwhile the lowest CMA past earnings result was in Q1 2020, when CMA posted adjusted EPS of -0.460/share. Turning to top line revenue performance, the biggest revenue quarter in our data set was seen in Q1 2023 when CMA reported 0.99B in revenue, while the smallest revenue quarter was Q1 2013 when CMA reported 616.00M in revenue.

Any self directed investor doing their due diligence on CMA or any other given stock can benefit from researching all of the Comerica past earnings — and here, we present each quarter's result all together on one page for easy comparison. Studying this information can help when projecting future earnings, as well as determining whether the past earnings trajectory justifies the current stock value. That's why we bring you PastEarnings.com to make it easy for investors to investigate Comerica past earnings, or the past earnings information for any stock in our coverage universe. And in your continued research we hope you will be sure to check out the further links included for earnings surprises history (beat/miss data) as well as next earnings dates for CMA. Thanks for visiting, and the next time you need to research CMA past earnings or those of another stock, we hope you'll think of our site, as your go-to past earnings research resource of choice.
Recommended: JFIN Videos, NINE Videos, Enphase Energy RSI.


CMA Past Earnings | www.PastEarnings.com | Copyright © 2020 - 2024, All Rights Reserved

Nothing in PastEarnings.com is intended to be investment advice, nor does it represent the opinion of, counsel from, or recommendations by BNK Invest Inc. or any of its affiliates, subsidiaries or partners. None of the information contained herein constitutes a recommendation that any particular security, portfolio, transaction, or investment strategy is suitable for any specific person. All viewers agree that under no circumstances will BNK Invest, Inc,. its subsidiaries, partners, officers, employees, affiliates, or agents be held liable for any loss or damage caused by your reliance on information obtained. By visiting, using or viewing this site, you agree to the following Full Disclaimer & Terms of Use and Privacy Policy. Video widget and market videos powered by Market News Video. Quote and option data delayed at least 15 minutes; stock quote data powered by Ticker Technologies, and Mergent.
X
Wait! Don't leave yet.
Want to receive our latest research absolutely free?


Click the button below for your complimentary copy of Your Early Retirement Portfolio: Dividends Up to 8.3%—Every Month—Forever.

You'll discover the details on 4 stocks and funds that pay you massive dividends as high as 8.3%.